The US stock market is fucking dumb. There is no clear trend to follow. The highs of certain indexes give us hope but…I’m seeing GOLD rip higher. The run higher in GOLD makes me wonder why I didn’t buy it in April when it started to move. I’m in GOLD now but it’s not the same as being their early.
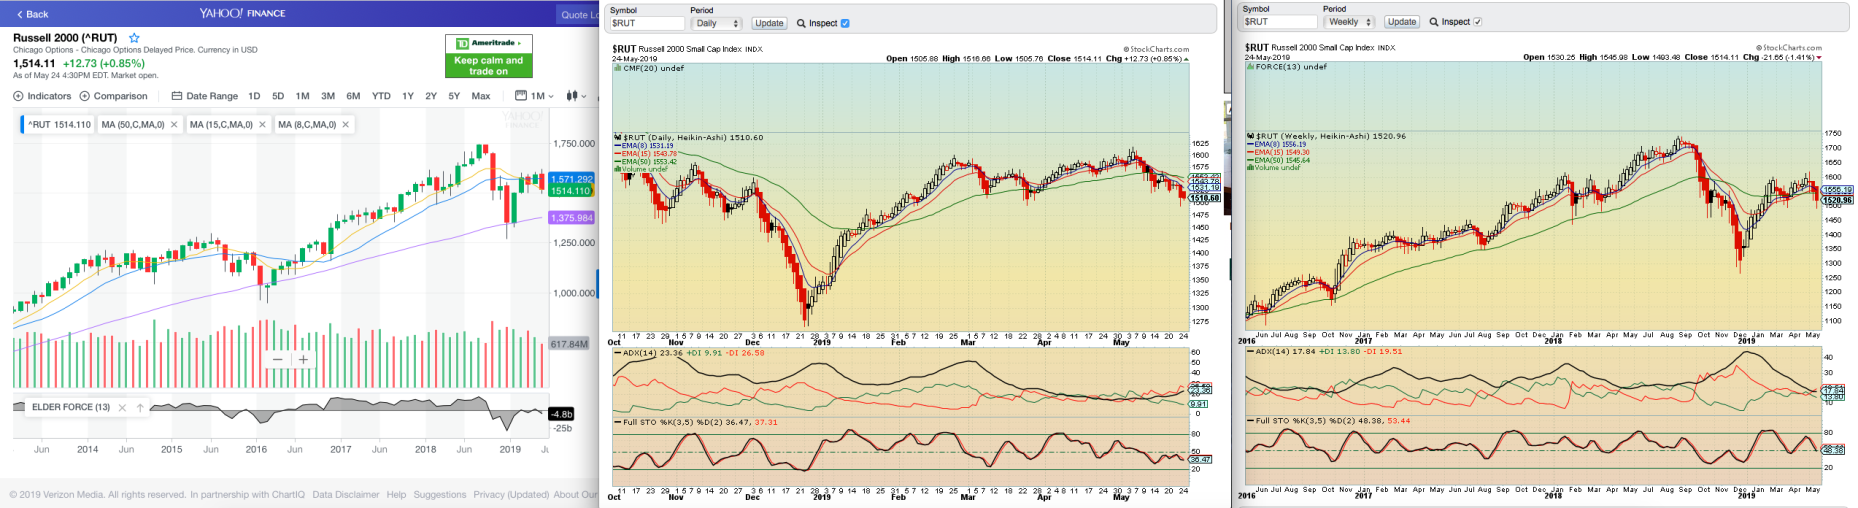
The RUSSELL 2000 needs to break 1600 for anything meaningful and 1700 for anything important. All it needs is a little push in one direction and it can go. I suspect over the summer with less volume in the market, we have a higher chance for more downside than upside. Q4 is different but in the next 90 days, we have to be cautious.
You can look at the daily, weekly and monthly chart yourself. Tell me what you see. Do you see an uptrend, neutral or downtrend? Looks neutral to me.
The NASDAQ looks like a lower high. Admittedly, I’m short at a very substantial loss at the moment.
The $QQQ and $XLK are my instruments to short tech. The force index on the monthly, weekly and daily are all positive. Not a great sign for my shorts…well I’m gonna learn a lesson and buy short-term call options against my position in hopes of recovering some of it.
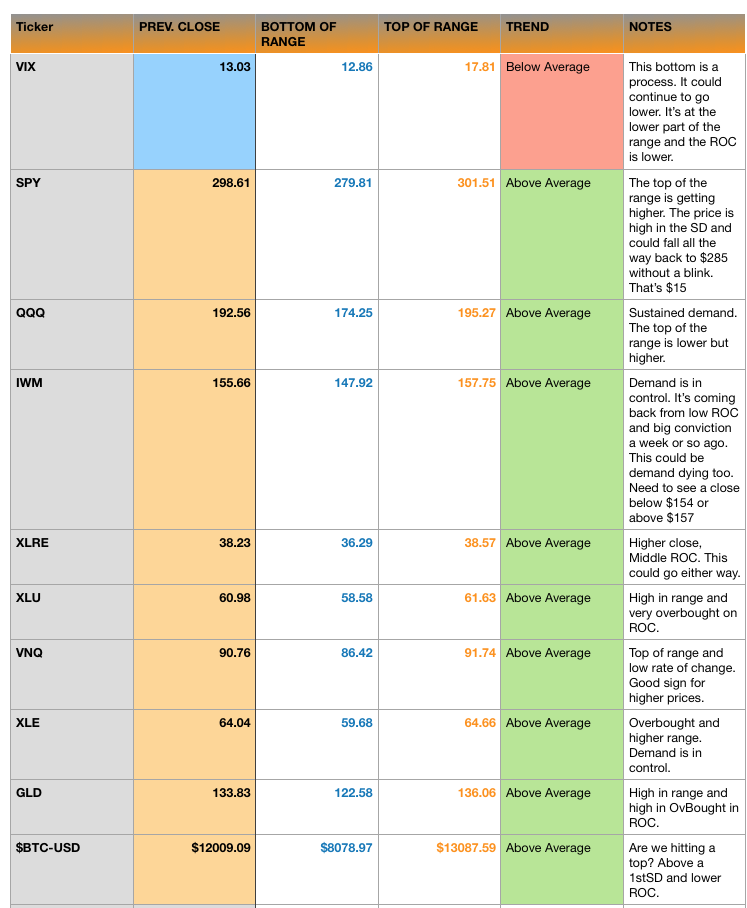
Since it’s the start of a new week, I’ll offer up the Sunday Night, Trade Zone:
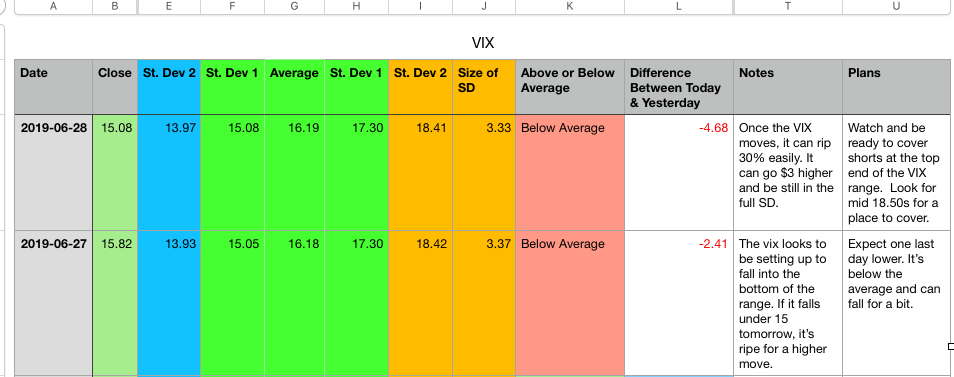
$VIX: $13.97 – $18.41
The $VIX is at the bottom of its zone. It could fall further but there is a high probability it will be much higher in 2-4 weeks.
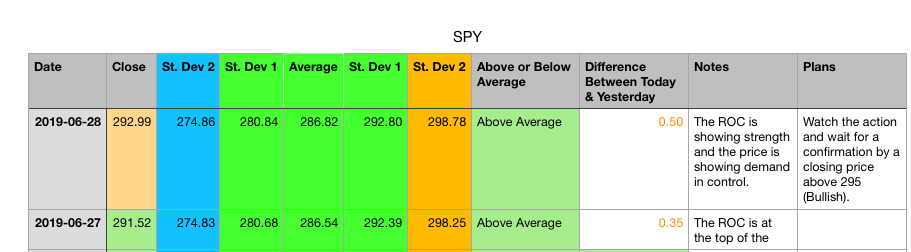
$SPY: $274.86 – $298.76
The $SPY is near the highs of its zone. It could fall back or rally higher. There is certainly more downside in the zone. Near it’s higher you can wait and watch.
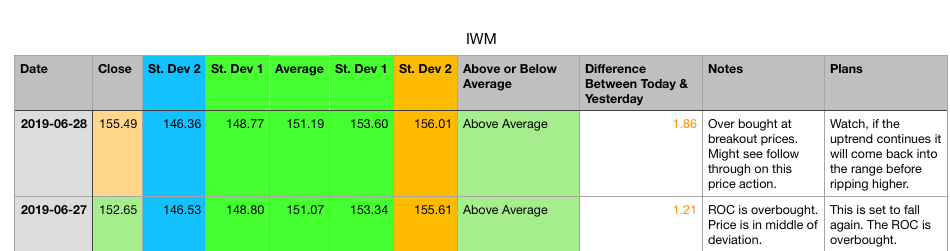
$IWM:
$146.36 – $156.01
$IWM is at the top of its zone too. This is aggressively purchased. It’s worth watching until it falls to the bottom of the range. Not sure I trust the uptrend for the RUSSELL. I might short from here. It’s a nice spot I think.
What do you think of the range?